Hi
I took a wav file which is recorded as 44.1 KHz 32 bits float (A) and played it through a DAC (Topping NX4 DSD) which I recorded the output through an iD14 as 96KHz 32 bits float (B).
Then I opened the spectrogram view through Audacity of both to check the difference and B is full of stripes at regular interval. I wonder what could be the explanation.
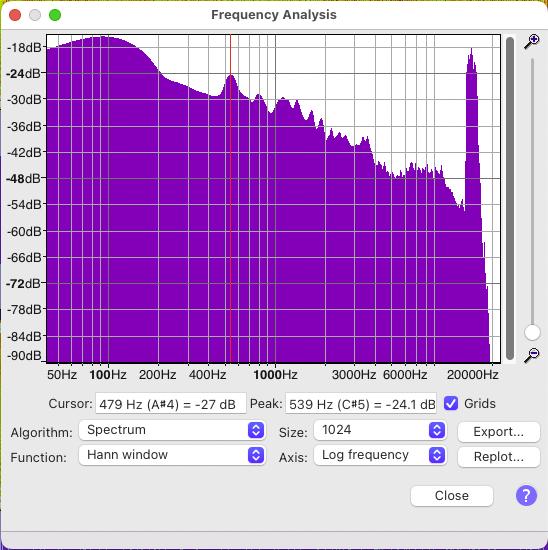
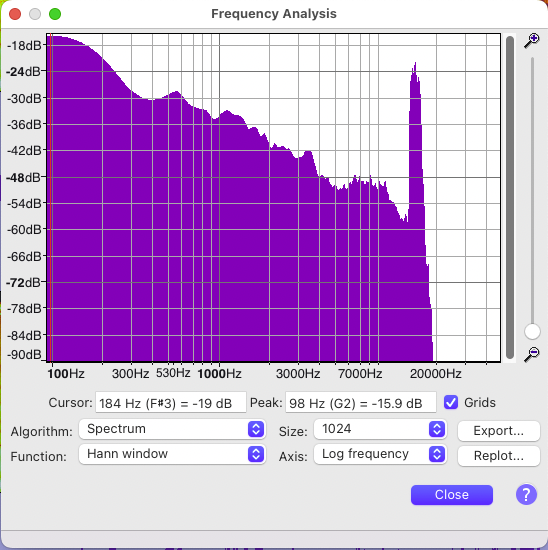
The spectrum plot has changed too.
A


B


I'm rather new on the spectrogram view but is willing to learn if somebody can point me to a good resource for.
Thanks

Comments
Do they sound different? If…
Do they sound different?
If you want to upload the wav audio, that would be interesting.
Hi the music is commercial…
Hi
the music is commercial and copyrighted so to abide by the forum rules I didn't post it. It sounds different after DAC processing which is good. Just look at the signals levels and you see A is saturated whereas B isn't.
I will try with a non saturated source first.
I will do the same experiment also with my voice recorded then processed by the DAC to see what's going on and post the files generated if the same phenomenon occurs.
I will also test by recording the DAC processed signal at the same resolution of the source to isolate wetheir the stripes come from DAC oversampling or not.
There are several things…
There are several things that don't add up for me in this thread.
You said what you did, but not why you did it. What were you looking for?
Surely you listened to the two audio files before using Audacity's FFT analysis on them? This would have told you instantly there was something very wrong with the comparison you thought you were making. Comparisons of this sort have to be done at exactly the same level.
If the A file was sent to the DAC and the B file is the result of sampling the DAC output, then the saturation is not shown in the B file so it was not present in the A file. How did the Audacity A file plot show a saturated waveform?
Are the A and B Audacity plots of the same time range? There is a large amplitude noise around 100Hz for the first two thirds of the B plot. This does not seem to be present in A, even allowing for the level increase.
The spectrogram time plots do not relate well to the waveforms in the time axis. Could they have been from different time periods in the files?
The waveform spectral plots in B don't have the components from 22.05 - 48 KHz, which you would expect from a file sampled at 96KHz. The spectral plot of the B file correctly shows the range to 48KHz, so Audacity knows it is a 96KHz file.
The frequency plots of both A and B have a large broad peak at around 14 KHz. This is showing up as a white horizontal band at that frequency on the time plots. It's not easy to say whether the A peak is actually the same frequency as B, since Audacity's Bode plot frequency axis is very suspect in the 7-10 KHz range. You need to find out what is causing this band.
As an aside, saying the waveforms are 32-bit float is not relevant here, and even misleading, since they are output by a 24-bit fixed point DAC and captured by a 24-bit fixed-point ADC. The float format is sometimes used when auto-gain structures are employed in the original sampling, but is otherwise simply a marketing tool since 32 is much bigger than 24.