Hello!
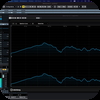
I recently got a Shure SM7b but I suspect it's defective. I've only recorded vocals for one song with it but felt there was something off with the sibilance so I analyzed it with Voxengo Span and noticed that there is a weird dip at 6500 Hz. It looks exactly like if there was an EQ with a very narrow bell with a pretty large decrease in dB at 6500 Hz.
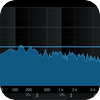
This is an average measurement using Voxengo Span. The audio is completely dry, the SM7b set to flat (i.e. no bass roll off or presence boost).
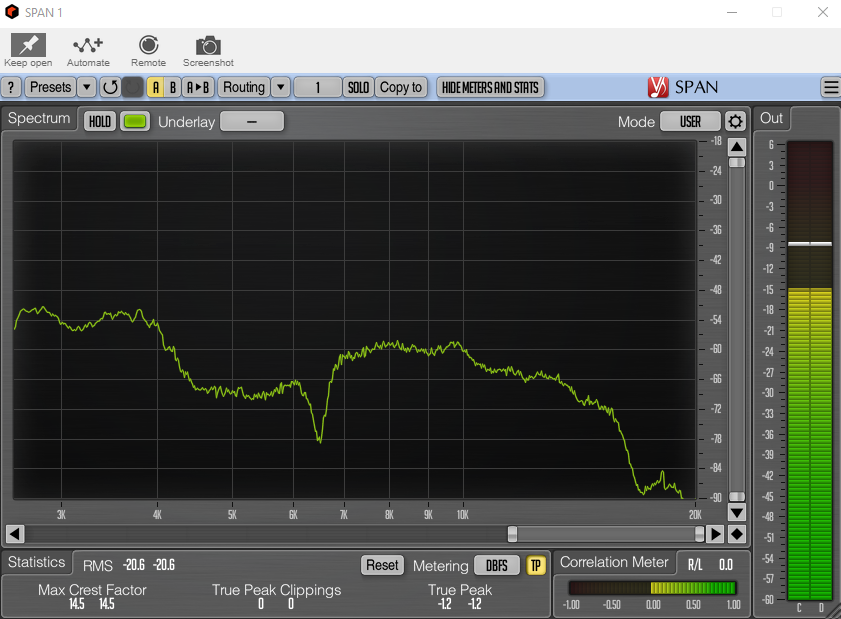
I have tried with two different DAC's (one from Focusrite and one from Native Instruments) and there's no difference.
Is this normal? I do understand that different microphones have different profiles but my intuition tells me this is not right.
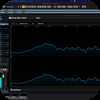
I only have a Shure Beta 58a to compare with but it does not behave like this with my voice. This is the same analyzis method using my vocals from a different song.
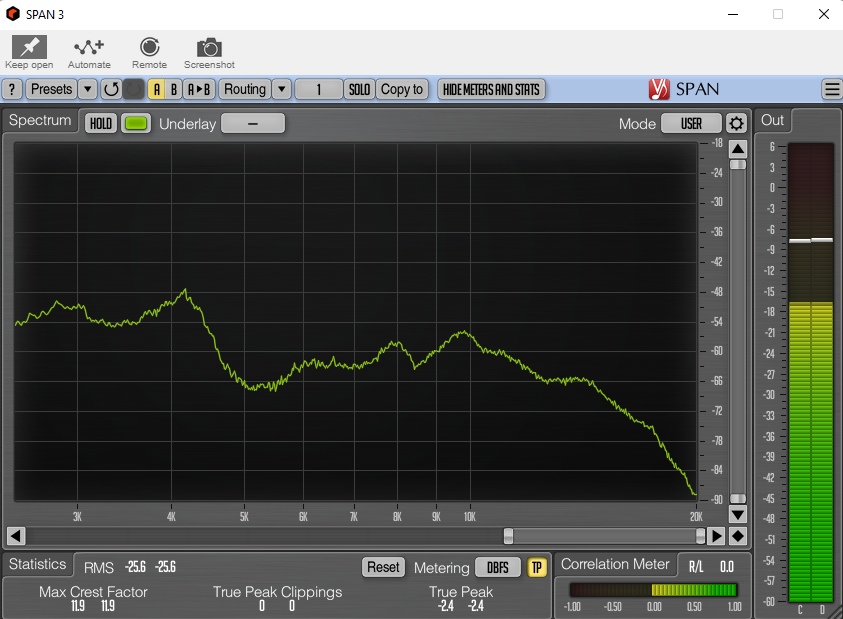
Comments
Thanks for answering. I…
Thanks for answering. I believe so. I have the gain knob at 3 o'clock using both interfaces, max is at approximately 5. I know that the sm7b needs more gain but I've seen many say this is just an issue when recording quiet stuff, which I don't. And sure, it's quieter than my Beta 58a but the levels are fine. This is recorded with the SM7b, no post gain and processing.
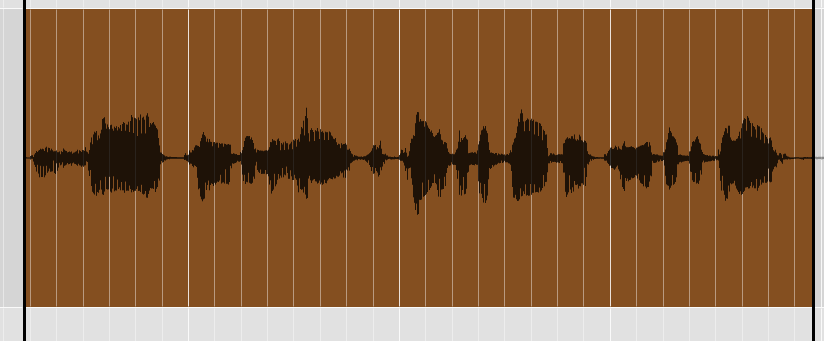
I could go up to 4 without any audible noise but this is normally the headroom I want to allow for more dynamic vocals, which is not the case here (it's rap).
Can lack of gain affect just one frequency? I have an old mixer I could use as a "cloudlifter" to test this.
The thing to remember about…
The thing to remember about this mic is that it does not behave like other mics. I had one and hated it, then I’ve grown fond of it, but it does not work on every voice. I had enough gain, I thought, but looking back, the mic only started to grow on me when I’d bought the preamp. It could be your preamp is what is introducing the issue?
are those plots based on pink noise? Not much use if they are of your voice, it’s not a constant. If they are pink noise, you could do the same test on your 58 to compare?
SM7B response notch
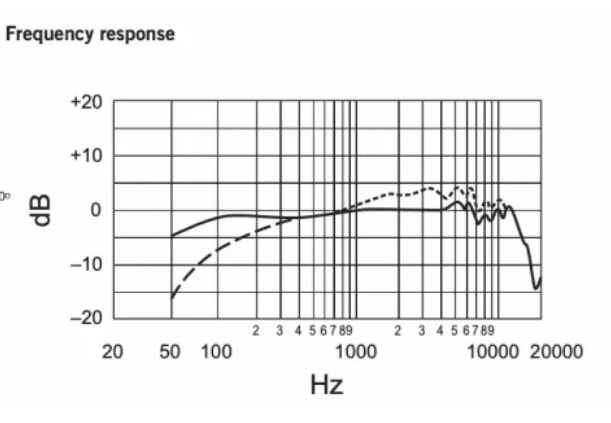
The SM7B does have bumps in its upper frequency response, particularly when the presence switch is set on. With the switch off (solid line in the curve below), the notch at around 7KHz is about 5dB, enlarging to 8dB with the switch on (dotted line). This is not as large as your curves show, but then presumably you are not making your measurements in an anechoic chamber using either a swept sine or a wideband noise source.
It's difficult to pinpoint anything further without much more detail about how you conducted the tests.
Thanks for your input. How…
Thanks for your input.
How do I go about this in the most proper way?
Should I record a sine sweep or pink noise through my monitors?
I only have budget monitors, M-Audio BX5 D2, but IIRC from reviews back then they should be fairly flat, the spec sheet says they go up to 22 kHz.
The monitors are only half…
The monitors are only half the equation. Your room acoustics are the other half.
My feeling is that you should use the SM7B as it is, without worrying that your room may be exaggerating the anomalies in the response curve. If you like or can accept the sound, then carry on. If not, you may have to dig a little deeper about what is causing the problems.
It would be worth your singing AAAAH into the microphone while moving around in the room, watching the spectral plot to see if some of the bumps are affected by exactly where in the room you are and in which direction you are pointing.
In order to avoid having to see the computer screen from everywhere, it would be better to record a few minutes of you doing the singing with movement, at each change speaking your place and direction. Do the analysis when you can sit and concentrate on it.
Ok, but if I put the mic…
Ok, but if I put the mic very close to the monitors and record with as little gain as possible? Since it's a dynamic mic shouldn't the room acoustics have less influence on the audio since it's so low in energy? That's why I love dynamic mics so much, you can record almost everywhere.
Maybe I misunderstand and you mean that the room itself can cause destructive interference at 6500 Hz?
You can't separate the voice…
You can't separate the voice from the room sound without installing some form of acoustic treatment such as drapes, baffles and bass traps The room is only reacting to and reflecting whatever your voice is doing. To get to a workable microphone level in your recording, you automatically amplify the room sound by the same amount as your voice.
The point about the monitors is that it is they that you will be using to assess the results, acoustically at least. They can lie to you as much as the room does.
Do you know any good source…
Do you know any good source for a proper pink noise audio file, or generator?
Is this ok, https://www.dynaudi… ?
Ok give me your opinions!…
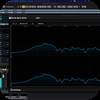
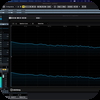
Ok give me your opinions! Pink noise recording. Beta 58a vs SM7b (with and without presence boost).
There is a small drop at ~8500 Hz with the Beta 58a but not as significant as the drop at 6500 for the SM7b. It looks better here compared to my first post but I'd say there's still a decrease of 9-10 dB at 6.5k.
You've done well to get…
The SM7B shares the same design of capsule as the SM57 and SM58, but, of course, the SM7B has a very different housing and mounting from the other two. It could well be that the dip you observe is an interaction between that type of capsule and the acoustic labyrinths of the housing. I don't know for certain whether the Beta range of Shure dynamic microphones uses a version of the same capsule, but I do know that a different type of magnet is used, and it's the magnet that is largely responsible for the increased sensitivity of the Betas over their SM cousins.
If it is an acoustic resonance causing the dip, it's not of the usual type, since resonances usually result in an increase in the response centred at the resonance frequency. Anti-resonances (absorptions) of this depth are less common, and would normally have a shallower, broader spread (lower Q).
I'm a professional electronics engineer, but not a microphone designer, so would be particularly interested in seeing posts on this topic from engineers in that specialist field.
I did the tests today but I…
I did the tests today but I need to do them again using a different analyser. In yours there is over 12dB between the peaks and dips which seems excessive, so I want to try a different scale and an analyser that can do a better job and be repeatable. I also tried analysing the pink noise direct without going through speakers and mic. I expected a straight line but got a slowly descending one so I need to sort this and repeat the test.
Really appreciate the effort…
Really appreciate the effort!
You could use Voxengo SPAN like I have, it's completely free and allows you to customize a lot. I think you got a descending line because the slope setting in the analyzer was set to 4.5 or anything over 3. I included my settings window for SPAN in the video. I think that using a slope of 3 or 4.5 is what most do to represent how the human ear perceives different frequencies, but it's not actually the true dB for every frequency.
This didn't go at all…
This didn't go at all according to plan!
Test 1
- Record some pink noise on the Sm7B and the Beta 58. It looked 'wrong'. I knew that my studio speakers wouldn't be flat, so any weirdness in their response would be included in the test results, but it would be equal on both mics - but the results didn't make sense - till I ran the pink noise (which I lazily sourced from Youtube) through the analysing process too - I should have seen pretty much a straight line, but it was nowhere near straight, so today, I generated some pink noise in cubase and did the tests again. My SM7B does indeed have a notch in the response, very similar to the one in this topic, and the Beta 58 version is not the same. Just one of those little things that makes the mic 'different' I guess.
Test 2
- Here are my results - pink noise played back via Cubase and then the recorded audio analysed in Cubase too. One thing I did have to do was adjust the response of the analyser to average the curve over a short time period - this let it settle down and the usual busy waveform settled down then. I found doing snapshots without the averaging process gave different results with each snapshot.
Pink noise falls off at 3db…
Pink noise falls off at 3db/octave (10dB/decade). White noise is equal energy per frequency multiple and so gives a flat line.
It's not that easy to generate a 3dB/octave (1/f) fall off. Most pink noise algorithms approximate a 1/f characteristic by performing a running sum of 4 or more pseudo-random white noise generators that update at Gray-coded intervals. By Gray coding, only one generator is summed into the total at any clock, making it easy to subtract that sample from the total at the end of the averaging period.
audiokid wrote: Could this…
audiokid wrote:
Could this all be caused from a comb filter?
I'd not thought about that Chris, but I tried all the different things I have that can display frequency in a spectrum display and clearly the process uses a timebase to scan from low to high then differnet maths applied to produce the screen display. I've got a spectrum analyser - that does 9KHz up to just over 1 GHz, and that has a similar display weirdness - you can select between a solid, stable display that is slower to update and faster one but that has the moving jiggly edge to it. As if the sampling frequency is sampling at intervals and then filling in the gaps on the next sampling cycle? Maybe that is how it has to be to be accurate - display resolution, vs update time? I think to get an absolute plot of frequency vs volume, you would have to do single tone tests, and plot the results and interpolated the level in the gaps. My spectrum analyser isn't much use for audio frequencies but it has a tracking generator - so as the frequency rises, the measurements get done along the increase line. This would give a very accurate and smooth response curve - such a shame it doesn't operate at audio frequencies -9K is a bit high to start!


Without knowing more about…
Without knowing more about your system, do you think have enough gain for the SM7B?